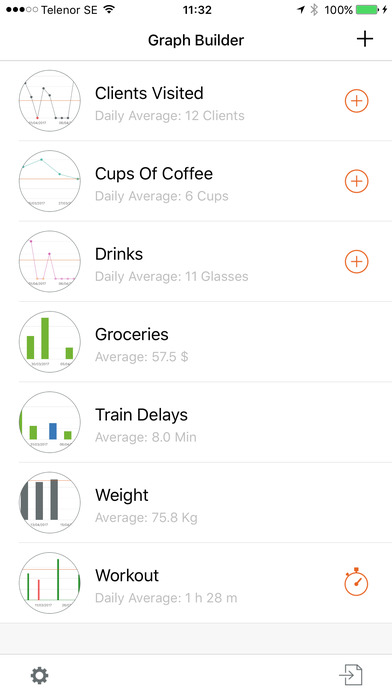
Build graphs the way you like, with your own data.
Trying to cut back on coffee? Set your target and enable Daily Counter Mode to keep track of how many cups you drink a day.
Use the Daily Timer Mode to keep track of the minutes you work out or study a day.
Other examples could be; tracking your weight, delays or keeping an eye on your expenses and sales
Features:
- Export and import your data to share between your devices or other users
- Export and import CSV data for use in Excel or Numbers
- Export a PDF document
- Send your graph as an image
- Send your graph data by email
- View as bar chart or line chart
- Import multiple values from text
- Enable Daily Timer Mode to track minutes per day
- Enable Daily Counter Mode to track units per day
- Select colours
- Set the units of your graph
- Add notes to your entries
- Toggle the entry ignore switch to exclude the value from you average
The free version is fully functional but limited to 25 entries, upgrade to create as many graphs and entries as you like.
Tips:
- Tap an entry for details and tap the balloon to edit
- Use 3D Touch (when available) in the main view to quickly view and share your graph
- Pinch the graph to zoom
- Tap the title when viewing a graph to change the name


